Power BI & business intelligence
Interactive dashboards that make performance visible, KPIs understandable, and decisions easier to act on.
I turn scattered data into clear decisions with thoughtful analytics, powerful Power BI dashboards, and reliable data pipelines built to scale with your business.
Practical data services that connect the technical details to the business questions behind them.
Interactive dashboards that make performance visible, KPIs understandable, and decisions easier to act on.
Reliable ingestion and transformation workflows that bring data together, improve quality, and make analytics repeatable.
Translate business goals into useful metrics, clean models, campaign insights, and reporting that teams can trust.
A selection of analytics and reporting projects across commercial and healthcare use cases. Dashboard previews are project work, not client endorsements.
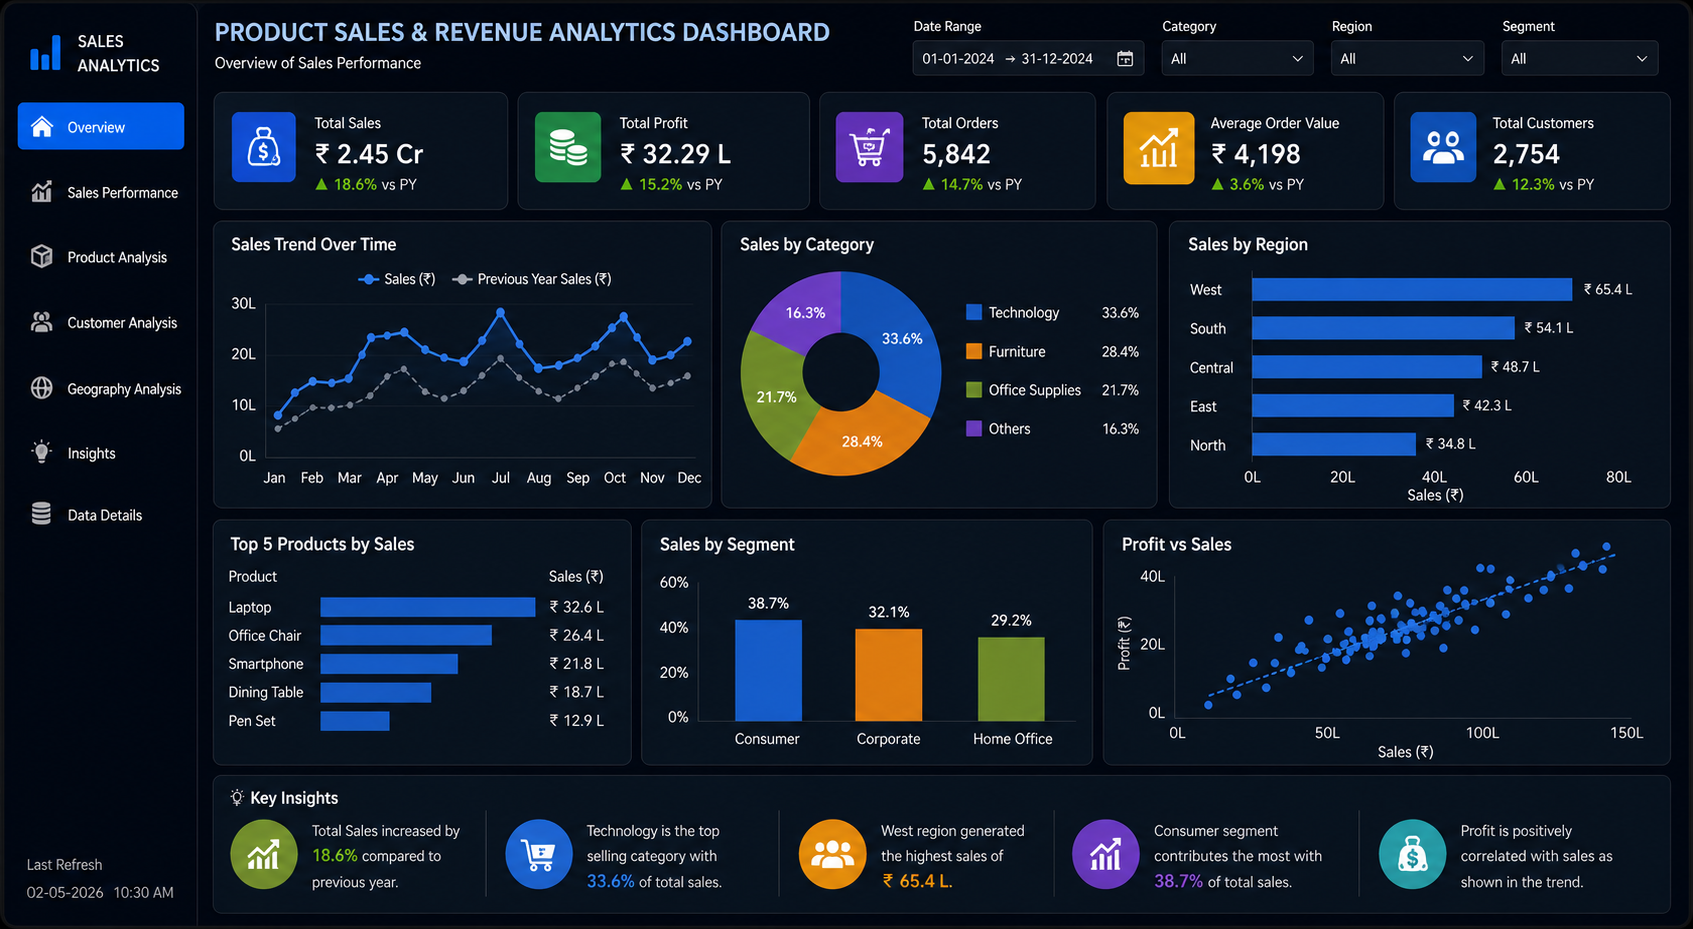
A sales performance view built to explore revenue patterns, product contribution, and business trends in one place.
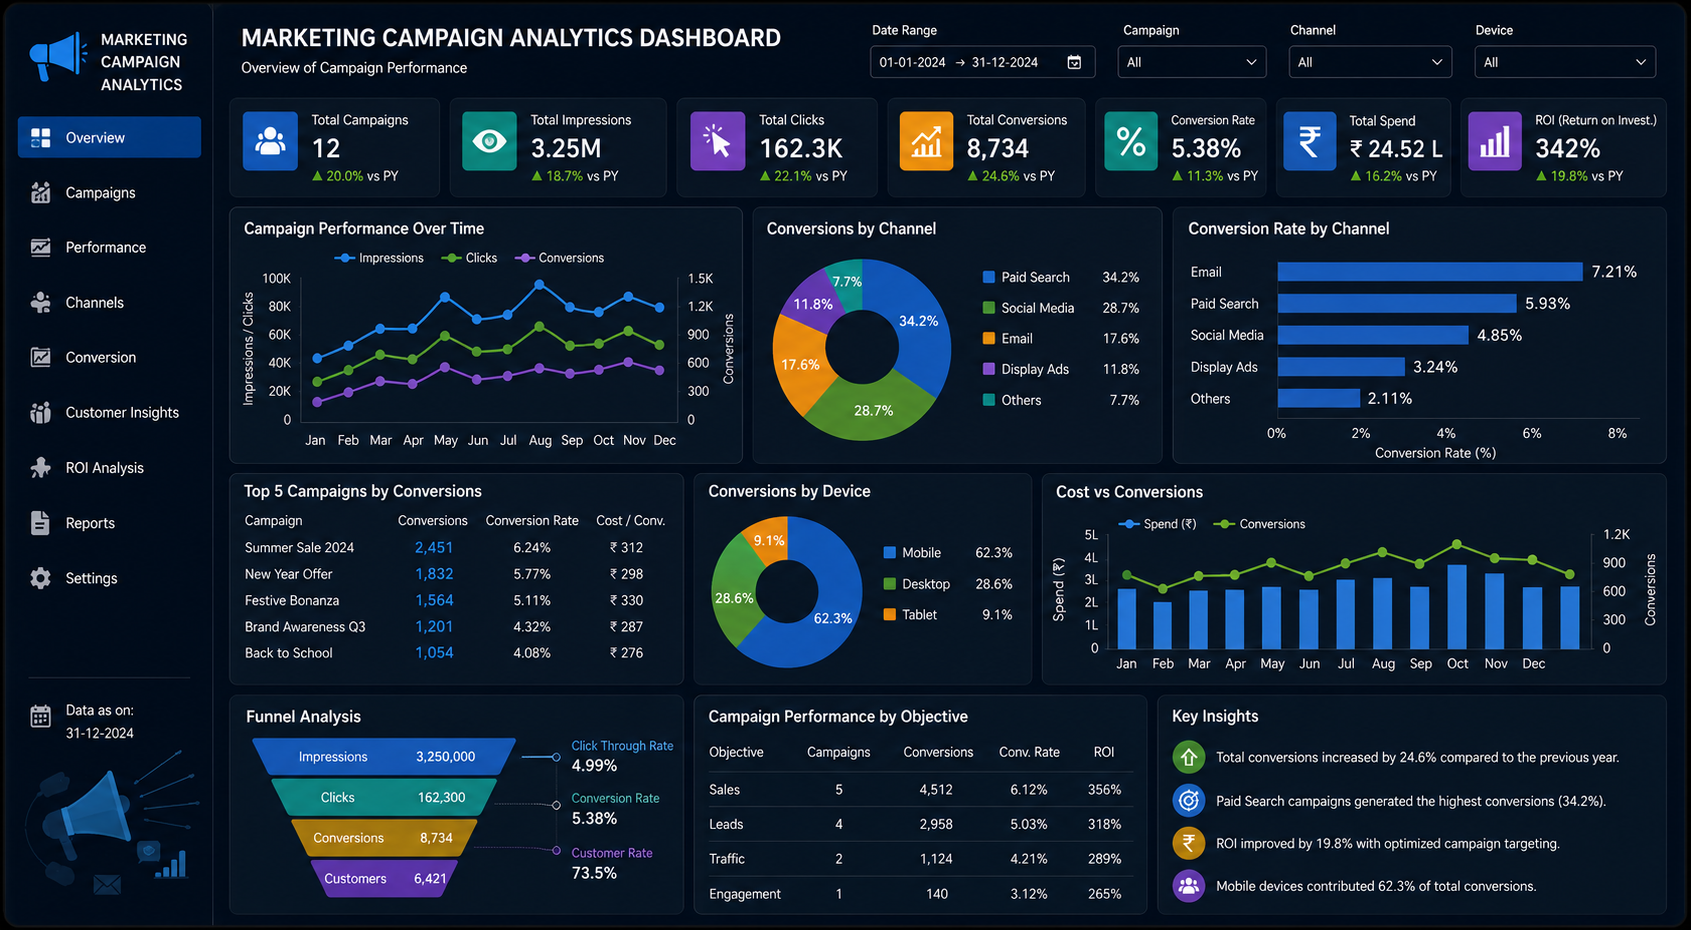
Campaign reporting for channel performance, lead generation, conversion efficiency, and return on marketing spend.
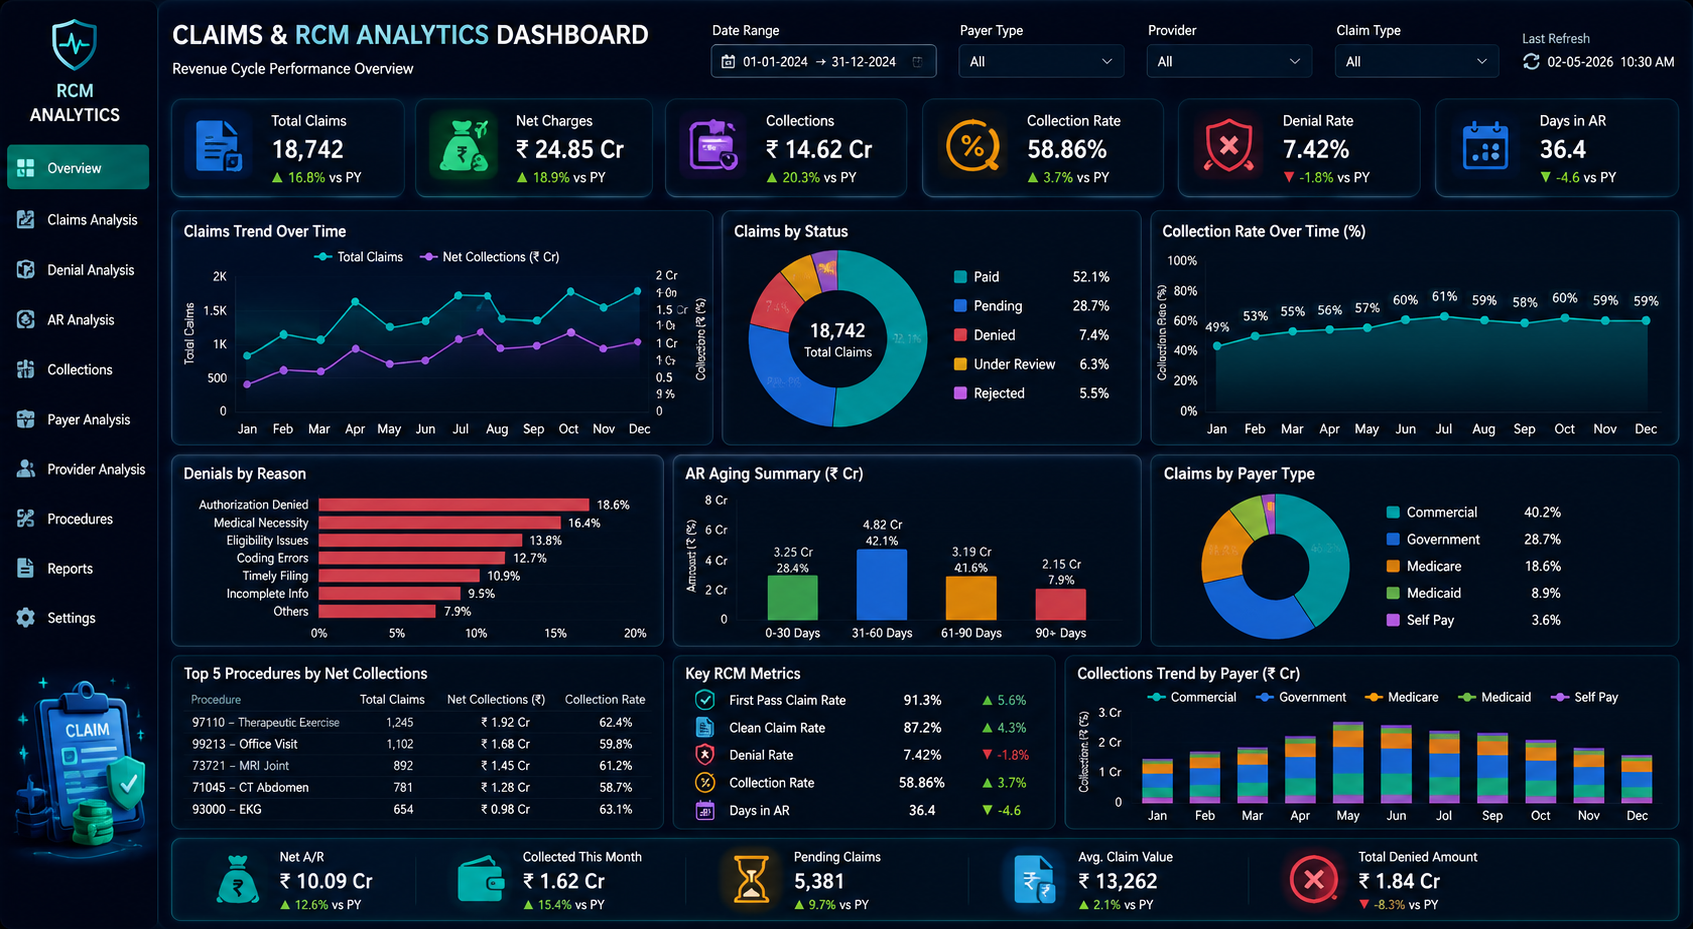
A healthcare reporting view for claims, billing gaps, outstanding amounts, and operational performance indicators.
A data-focused case study concept for organizing transaction signals, applying quality checks, and preparing reliable datasets for analysis.
Behind every useful report is a pipeline that collects the right data, transforms it consistently, and makes quality visible. I bring engineering discipline to the whole path—not just the final chart.
A collaborative approach that starts with the business problem and ends with something your team can use and maintain.
Align on goals, users, data sources, definitions, and the decisions the solution should support.
Agree on metrics, data models, pipeline flow, dashboard layout, and delivery milestones.
Develop iteratively, test the logic, review outputs together, and improve based on feedback.
Document the solution, explain key decisions, and make the deliverables practical to maintain.
Tell me what you’re trying to understand, automate, or improve. Share a little context and I’ll start with the problem—not a pre-packaged solution.